
A few years ago I wrote an AI application to trade stock options. Over time it has grown into a modest project called PowerMax. People occasionally ask me, “How does AI trade stock options?” Perhaps this article provides some insights into that question.
PowerMax finds millions of patterns in stock and option prices. Using these patterns PowerMax finds profitable trades to make your money work harder so you have the freedom to create ever more interesting patterns in your life.
Earnings reports, macro-economic changes, major events, and the individual actions of millions of individual and institutional investors all interact to create millions of nonlinear patterns in every stock price chart. For stock options the number of combinations and patterns is much larger because the CBOE lists over one million different stock option contract tickers each year, compared to about 7,000 stock tickers listed on US stock exchanges.
One might say that prices for stocks and stock options are nothing but patterns. These patterns are like the patterns we can see visually, such as forests, trees, leaves, or flowing water, but they are not visible to us until we plot them on a chart.
We can create visual images of stock price patterns, but what we see in the chart is only a tiny window into the millions of patterns hidden in stock charts. Our chart will often be focused on uninteresting data, largely missing the important patterns that are hidden in different data combinations across different time scales. Because the search space is so large, we can never find interesting data and time scales with only human perception.
To find interesting data and timeframes that combine to create interesting charts, we need to use the appropriate search tool. To find an interesting website, we don’t scroll through a list of all the websites and articles on the web. We use a web search engine. Similarly, to find interesting data and timeframes for stock prices, we must use a data search engine. The best data search engines are AI programs. They are the only ones that work.
For stock and option trading data, we define interesting as “profitable.” Out of the fifty million or so possible option trades each year, PowerMax finds and executes the most profitable trades. Oddly, PowerMax does not make predictions. It simply finds patterns with a high sequential probability of occurrence.
The Round Number Pattern – One of a Million Patterns
The round number pattern is only one of the millions of patterns embedded in stock and option prices. In their book Thinking Fast, Thinking Slow, the authors Daniel Kahneman and Amos Tversky found and measured many human biases, including the Anchoring Bias and the Recency Bias. The round number bias (or pattern) acts as a combination of these two biases.
The round number pattern is only one example of the millions of patterns humans may seldom see, but PowerMax finds easily. Humans like round numbers. The number 500 is much more memorable and appealing than 537 or 482. Numbers ending in 50, 25, and 10 are also appealing round numbers. Does our human bias for round numbers show up as a pattern in stock prices? The following stock price chart for SMCI (August 2023 – January 2024) displays an example of a round number pattern.

Clearly something dramatic happened to this stock price for SMCI on January 19, 2024. The tighter time range (Jan 6 – 24, 2024) below shows more detail.

At this time scale, can you pick out the price trend and the round number bias that interrupted it?

Above is the same chart with the two trend lines drawn in. The first line shows the upward trend and the second (horizontal) line shows the round number pattern near $350, a conveniently round number. Can you see another, shorter, round number bias just below $325?
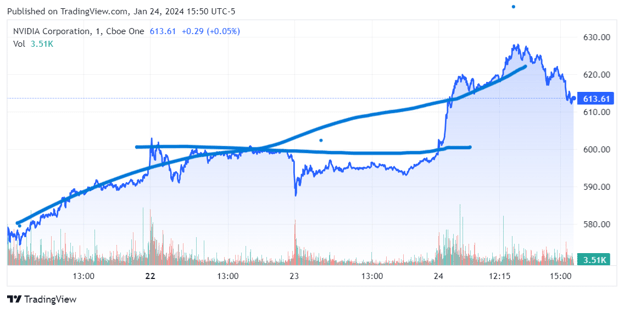
Round Number Bias with NVDA
This four-day chart (Jan 21-Jan 24, 2024) exhibits a strikingly flat round number bias just below $600 during Jan 22-23. It also shows an uptrend that was interrupted while NVDA overcame the round number bias. See if you can trace the two trends.

Below is the same chart with the trend line and horizontal round number bias drawn in.
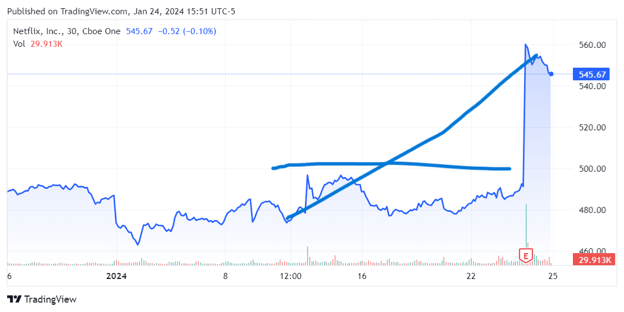
Round Number Bias with NFLX
The chart below (Jan 2024) for NFLX shows another uptrend interrupted by a round number bias below $500. Try to sketch in the trend and bias just below $500.

Below is the same chart with the lines drawn in.
These round number patterns are often called support and resistance levels. They sometimes correlate with high-volume price points. Some chartists use variations of the Fibonacci ratio to calculate these support and resistance levels. Followers of Elliot Wave theory combine these to visualize repeating, fractal wave patterns in stock price charts.
Being human, we try to construct explanations and attach meaning to almost everything. We find patterns in rocks, trees, clouds, stars, wind, snowflakes, and flowing water. Occasionally these patterns reveal underlying structures. More often the patterns we see are only the result of our imagination and creativity. Very entertaining, but perhaps not a good basis for trading stocks and options.
The round number pattern is only one possible pattern among millions hidden in the data. PowerMax is a powerful computer program with no innate emotions or desires for meaning. It identifies these millions of patterns and correlates subsequent price patterns with previous patterns. These correlations, or probabilities, of certain patterns look and feel like predictions to us. To PowerMax they are just sequences of patterns with high probabilities.
PowerMax finds millions of patterns in stock and option prices. Using these patterns PowerMax makes your investments more profitable so you have the freedom and resources to create ever more interesting patterns in your life.
